What Is Model Drift in Machine Learning?
Model drift, broadly defined, is a situation where a machine learning (ML) model’s performance degrades over time. This could be due to changes to the statistical properties of the input data, the predictive model’s target variable, or other changes to the way the model is trained or operated. Model drift could be either due to changes in the model’s external environment or due to the model’s intrinsic properties.
For example, a predictive model designed to forecast stock prices may work well initially and then at a later stage start providing inaccurate predictions. There could be several reasons:
- Seasonal changes to the stock market, affecting the model’s inputs (data drift).
- Changes to the economic situation, changing the way inputs affect target variables (concept drift).
- Unexpected outputs or errors due to the model’s complexity or instability.
Machine learning models operate in a dynamic, where input data and the real-world phenomenon they observe are in constant flux. Over time, these models can ‘drift’ away from their original performance metrics. This drift could be an indication that the model needs to be retrained or adapted to new circumstances, or could be an indication of a problem with the underlying production model.
Why Is Model Drift Important?
Model drift has real-world implications that data scientists, machine learning engineers, and business decision-makers should be aware of. Understanding model drift is critical because it can significantly impact an ML model’s performance and, consequently, the decisions made based on that model’s predictions.
A drifting model’s predictions become less accurate over time. This loss of accuracy can have severe ramifications for businesses, especially those that heavily rely on predictive analytics to drive decision-making. For instance, a financial institution using a drifting model to predict loan defaults might underestimate the risk, leading to significant financial losses.
Moreover, model drift can also lead to a loss of trust in machine learning models. When predictions consistently fail to match reality, stakeholders may begin to question the model’s validity and the value of investment in machine learning. This can slow down the adoption of machine learning in organizations and negatively affect end-user experience.
Why Do Models Experience Drift?
There are several reasons why models experience drift, and they are often linked to the dynamic nature of the world we live in. As environments and behaviors change over time, so too do the relationships that a model has been trained to understand:
Concept drift: This occurs when the relationship between the input variables and the target variable changes over time. For instance, during a recession, consumer spending habits may change drastically. If a model trained on pre-recession data is used to predict spending during the recession, it is likely to perform poorly because the underlying concept has drifted.
Data drift: This happens when there are changes to the input data’s distribution over time. This could be due to shifts in population demographics, changes in data collection methods, or even errors in data entry. These changes can cause the model to drift as the new data no longer align with the data the model was originally trained on.
Model complexity and instability: Some models may experience drift due to their own complexity. Machine learning models, especially those using deep learning techniques, can be highly complex. This complexity can sometimes lead to instability, with small changes in input data leading to large shifts in output predictions. This is known as model instability.
Model Drift Metrics
There are several metrics you can use to monitor for model drift. Here are the most common ones:
Kolmogorov-Smirnov (KS) Test
The Kolmogorov-Smirnov (KS) Test is a non-parametric statistical test used to compare the distributions of two datasets, or a dataset with a reference probability distribution. In the context of model drift, the KS Test is utilized to compare the distribution of the model’s predictions against the distribution of the actual outcomes, or to compare the distribution of recent data to the data the model was originally trained on.
This expression compares the empirical CDFs of two samples, denoted as Sn1 and Sn2:

The KS Test is particularly useful because it makes no assumption about the distribution of data, making it versatile for various types of data. However, its sensitivity decreases with small sample sizes, and it might not detect subtle changes in distribution, which could be crucial in identifying early stages of model drift.
Population Stability Index (PSI)
The Population Stability Index (PSI) is a statistical measure used to quantify the change in the distribution of a variable over time. It’s especially useful when you need to assess whether the population on which a model was trained (the “expected” population) has shifted significantly compared to a new, more recent population (the “actual” population).
To calculate PSI, the data is first binned into categories. Frequencies of these categories in the expected and actual populations are then calculated and used to compute the PSI using this formula, summing up over all the categories:

Z-Score
The Z-score is a statistical measure that indicates how many standard deviations an element is from the mean of a set of elements. It’s used to detect outliers or significant changes in data points over time, which can be indicators of model drift.
To calculate the Z-score of a data point, first, the mean (average) and standard deviation of the dataset are computed. The Z-score is then calculated using the formula:
In model drift detection, Z-scores can be applied to the model’s prediction errors or to key features. A significant change in the Z-scores over time can indicate that the data distribution is changing, which might affect the model’s accuracy and reliability. Z-scores are particularly effective in identifying when individual data points or features deviate significantly from their historical patterns, which is a common occurrence in model drift.
How to Detect Model Drift
Performance Metrics Monitoring
The first step in detecting model drift is through performance metrics monitoring. By keeping an eye on your model’s basic performance metrics, like accuracy, precision, recall, and F1 score, you can notice any sudden or gradual changes. A decline in these metrics often indicates model drift.
Monitoring performance metrics is not just about looking at raw numbers. It’s also about interpreting them in the context of your model. For example, a sudden drop in accuracy might be due to an outlier in your data, and not necessarily model drift. Thus, it’s vital to understand what these metrics mean for your specific model and use case.
Regularly Analyze Errors and Mispredictions Made by the Model
Lastly, you can detect model drift by regularly analyzing the errors or mispredictions made by your model. By looking at where your model is going wrong, you can get insights into whether it’s drifting.
For example, if your model starts making errors it wasn’t making before, or if it starts making the same errors more frequently, it could be a sign of model drift. It’s important to consider whether these errors are due to changes in the data or due to the model itself.
Data Distribution Monitoring
Data distribution monitoring means regularly checking and analyzing the distribution of your input and output data. If data distribution changes significantly over time, it could lead to model drift. For example, if your model was trained to predict house prices based on data from a specific city, and then the data starts to include houses from other cities, the model’s predictions may start to drift.
It’s not just about monitoring the data distribution, but also understanding the cause behind any changes. If the changes in data distribution are due to natural variations, it might not be a cause for concern. But if the changes are due to factors like environmental changes, changes to data collection methods, or new data sources, it might require action
Utilize SPC Methods
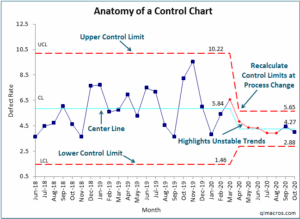
The next approach to detect model drift is by using Statistical Process Control (SPC) methods. SPC is a method used to monitor, control, and improve a process through statistical analysis.
In the context of model drift, we can use SPC charts, such as control charts, which can help us visually inspect if the model’s performance is within acceptable limits or if it’s drifting. If the model’s performance falls outside the control limits, it indicates a non-random cause of variation, which could be model drift.

4 Ways to Avoid and Prevent Model Drift
Now that we know how to detect model drift let’s look at how to avoid and prevent it.
1. Regularly Updating and Rebalancing Training Data
To avoid and prevent model drift, it is crucial to regularly update and rebalance the training data. This involves adding new data that reflects recent trends and removing outdated or irrelevant data. The goal is to ensure that the model continues to learn from a dataset that accurately represents the current environment.
Additionally, rebalancing the dataset to correct any biases or imbalances is essential. This helps the model to maintain its accuracy and relevance over time, especially in rapidly changing environments.
2. Tuning the Model
Model tuning is an ongoing process to adjust the parameters and structure of the model to better fit the evolving data. This can involve techniques such as hyperparameter optimization, where the algorithm’s settings are fine-tuned for optimal performance.
Regularly assessing the model’s performance and making adjustments can prevent overfitting to old data and underperformance on new data. It’s important to balance the complexity of the model with the quality and quantity of the available data to avoid overfitting.
3. Rebuilding the Model
In some cases, the changes in the environment or the data might be so significant that mere tuning is insufficient. In these situations, rebuilding the model from scratch with the latest data and techniques can be more effective.
This process includes re-evaluating the features used, the type of model, and the data preprocessing steps. Rebuilding the model can be resource-intensive but might be necessary to adapt to fundamental changes in the data landscape.
4. Adopting MLOps
MLOps, or Machine Learning Operations, is a set of practices that combines machine learning, DevOps, and data engineering to automate and improve the lifecycle of machine learning models. Implementing MLOps can significantly aid in preventing model drift. It ensures continuous monitoring, testing, deployment, and management of ML models in production.
By integrating MLOps into the workflow, organizations can respond quickly to model drift, deploy updates efficiently, and maintain the reliability and accuracy of their machine learning models over time.
Testing and Evaluating ML Models with Kolena
Kolena makes robust and systematic ML testing easy and accessible for any organization. With Kolena, machine learning engineers and data scientists can uncover hidden machine learning model behaviors, easily identify gaps in the test data coverage, and truly learn where and why a model is underperforming, all in minutes not weeks. Kolena’s AI / ML model testing and validation solution helps developers build safe, reliable, and fair systems by allowing companies to instantly stitch together razor-sharp test cases from their data sets, enabling them to scrutinize AI/ML models in the precise scenarios those models will be unleashed upon the real world. The Kolena platform transforms the current nature of AI development from experimental into an engineering discipline that can be trusted and automated.
Among its many capabilities, Kolena also helps with feature importance evaluation, and allows auto-tagging features. It can also display the distribution of various features in your datasets.
Model Drift: How Kolena Can Help
Kolena stratifies data by time on top of various scenarios. Simply set up data ingestion by day or by hour, and see how your model performance metrics change across different models and different scenarios over time. You’ll know when performance suddenly drops, and precisely why it dropped.
Reach out to us to learn how the Kolena platform can help build a culture of AI quality for your team.


